Navigating the Quicksight Interface
Get Up to Speed with QuickSight Jul 13, 25
Here is the sample interface of Amazon Quicksight. The ones that I boxed could be referred to as toolbars, like those present in software such as the Microsoft Office Suite.
If you want to edit a chart, you can do it in the Properties pane in the orange box, which is thankfully only available in its dedicated area on the right.
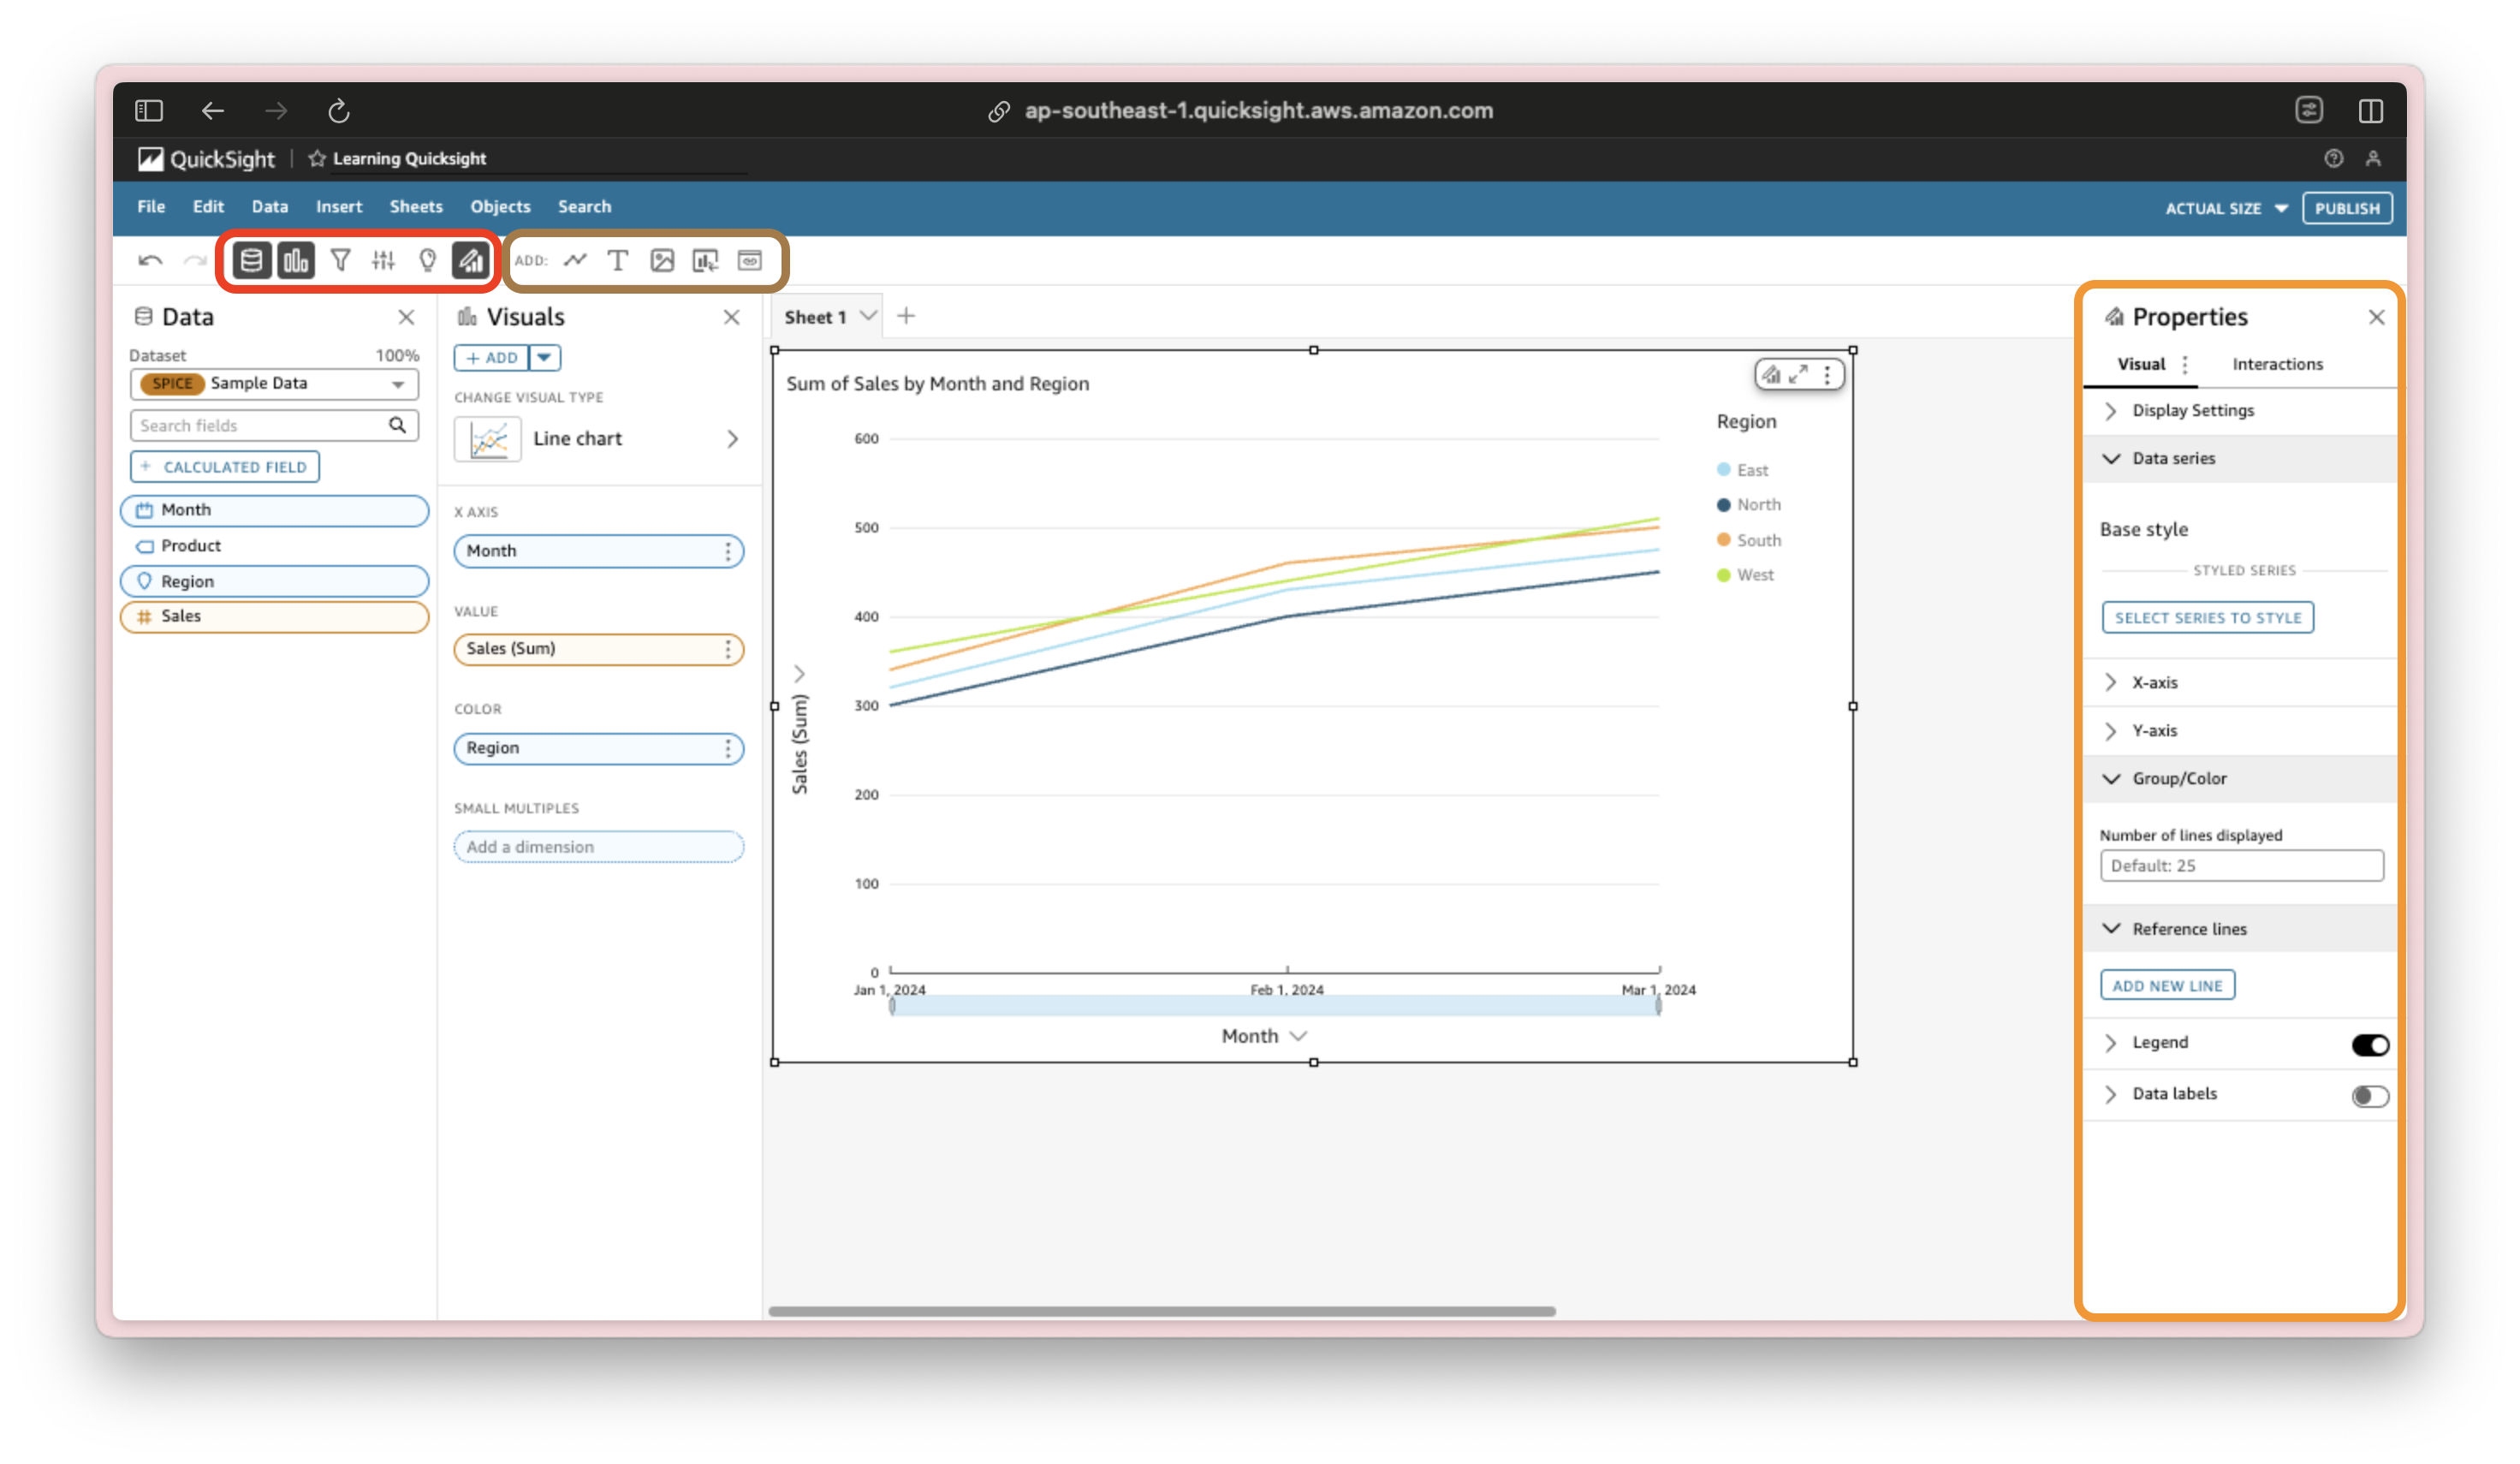
- The red box acts like a toggle, appearing in the sidebars when selected:
-
Icon Hover Name Data Chart Filter Parameters Insight Properties
-
- The brown box contains the components that you can add to the dashboard.
-
Icon Hover Name Add Visual Add Text Add Image Import Add custom content
-
- The buttons on the left of the red box are the undo and redo buttons.
-
Icon Hover Name Undo Redo
-
If the toggles in the red box are unpressed, it would look like this:
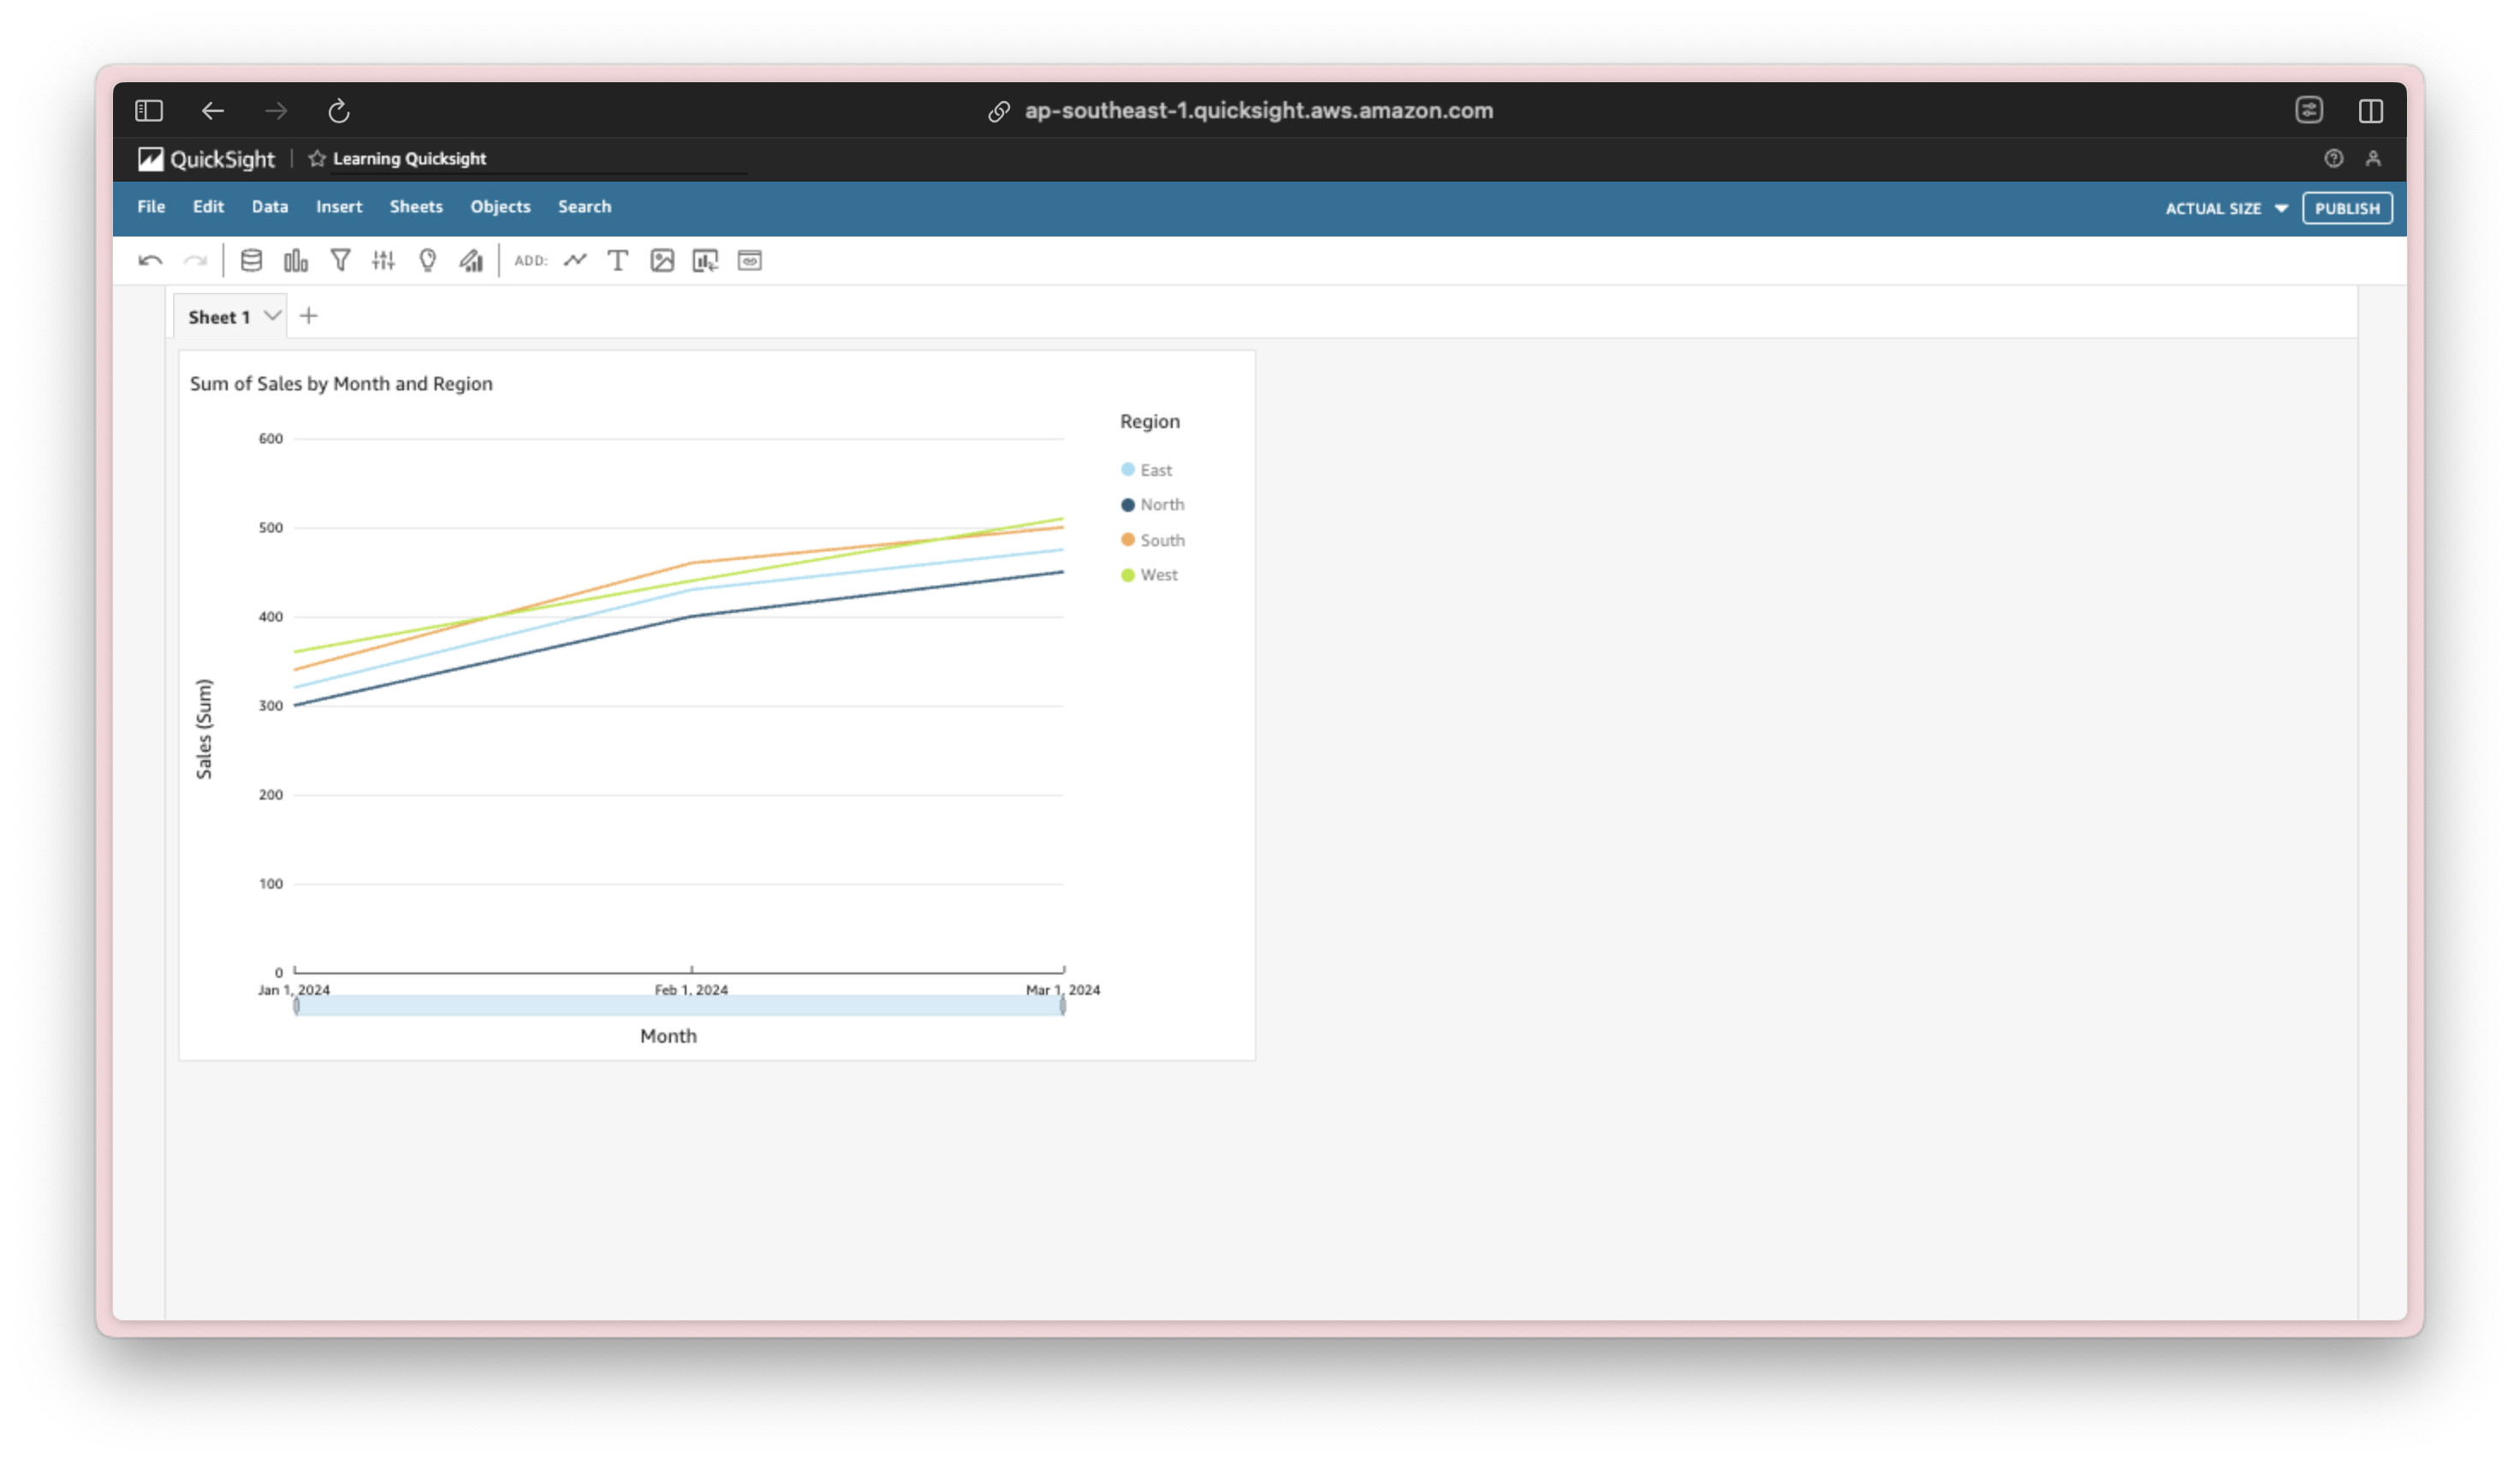
It would be like a clean slate, where you really can’t do anything unless you press something in the toolbar. The toolbar is what you would use 90% of the time to create and modify visual charts in QuickSight.